Question
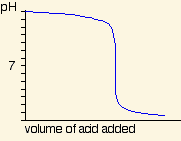
The graph above shows the titration curve of a ____.
Answer
The graph above shows the titration curve of a strong base with a strong acid.
The pH begins extremely basic (strong base) and drops to extremely acidic (titrated with strong acid).
Keep this card coming back until it sticks
Sign up free and spaced repetition will bring MilesDown: General Chemistry cards back right before you forget them.
Continue studying — sign up freeMore cards in MilesDown: General Chemistry
In element notation, A is the ____
In element notation, Z is the ____
____ is the weighted average of the masses of an element's isotopes .
Atomic weight is ____.
The ____ states that an atom is mostly empty space, with electrons orbiting a fixed, positively charged nucleus.
The Rutherford Model states that ____.